Relative strength and Mansfield RS
How TRINITY measures a stock's performance against the market benchmark—and why it's a different metric from the RSI you already know.
Two metrics, one confusing name
The investing world has two very different things called “relative strength,” and the distinction matters:
-
Wilder’s RSI (Relative Strength Index) — A momentum oscillator that compares a stock’s average gains to its average losses over the past 14 periods. It ranges from 0 to 100 and has nothing to do with the market benchmark. This is the RSI you’ll see on most charting platforms.
-
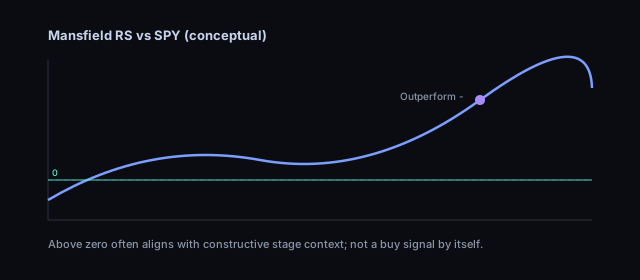
Mansfield Relative Strength — A measure of a stock’s performance relative to the S&P 500. Named after Stan Weinstein’s mentor, investor Don Mansfield, it tells you whether a stock is outperforming or underperforming the broad market over the same period. This is what TRINITY’s ATHENA engine uses in stage analysis.
They are both called “relative strength” in common usage, which creates constant confusion. In TRINITY, RS or Mansfield RS always refers to the market-relative measure, not the RSI oscillator.
How Mansfield RS is calculated
ATHENA computes Mansfield RS in three steps:
Step 1 — Compute the raw relative performance (RP)
For each day, divide the stock’s closing price by SPY’s closing price and multiply by 100:
RP = (Stock Close / SPY Close) × 100
This gives a ratio that rises when the stock outperforms SPY and falls when it underperforms.
Step 2 — Smooth the ratio
Take a moving average of the RP values over a defined window (typically 52 weeks for Weinstein-style analysis). This creates a baseline that represents “normal” relative performance for this stock.
RP_SMA = Simple Moving Average of RP over the lookback window
Step 3 — Normalize to a Mansfield RS value
Mansfield RS = ((RP / RP_SMA) - 1) × 100
The result is expressed as a percentage:
- Positive Mansfield RS → the stock is outperforming SPY relative to its own history
- Zero → the stock is performing in line with its own historical ratio to SPY
- Negative Mansfield RS → the stock is underperforming SPY relative to its own history
What the number means in practice
| Mansfield RS | Interpretation |
|---|---|
| +50 or higher | Strongly outperforming the market; the stock is leading |
| +10 to +50 | Moderate outperformance; favorable but not extreme |
| -10 to +10 | Roughly in line with the market; neutral RS signal |
| -10 to -50 | Moderate underperformance; lagging the market |
| -50 or lower | Significantly underperforming; the stock is a market laggard |
These thresholds are approximate. The direction of change often matters as much as the absolute level—RS that is improving from -20 to 0 is more constructive than RS that is declining from +50 to +20.
Why positive Mansfield RS matters for stage analysis
Stan Weinstein’s framework emphasizes a simple principle: buy stocks that lead the market, not stocks that trail it. The intuition is that institutional money—mutual funds, pension funds, endowments—tends to flow into the strongest performers and exit the weakest. Positive Mansfield RS is a proxy for where that institutional flow is going.
In practice:
- A Stage 2 stock with positive Mansfield RS is advancing while also outperforming the benchmark. That’s a double confirmation of strength.
- A Stage 2 stock with negative Mansfield RS is advancing, but the market is advancing faster. The stock may be moving in line with a rising tide rather than demonstrating genuine leadership.
- A Stage 1 stock with rising Mansfield RS (turning from negative toward positive) is showing early signs of institutional accumulation before the price breakout—a setup Weinstein highlighted as particularly attractive.
Mansfield RS as a SATA component
Within the SATA score, Mansfield RS contributes Component 5: a binary 0-or-1 score based on whether Mansfield RS is greater than zero.
This means that simply having positive relative strength adds one point to the SATA composite. The full nuance of RS (how strongly positive, which direction it’s trending) is captured in the raw Mansfield RS reading you see on the symbol page, not in this single binary component.
When SATA is low despite a positive stage label, one common cause is a negative Mansfield RS—the stock is classified as Stage 2 on price structure alone, but it’s not outperforming the market.
How TRINITY uses Mansfield RS in signals
Beyond SATA, Mansfield RS directly gates signal strength in ATHENA’s signal engine. A strong BUY signal typically requires Mansfield RS ≥ 25 as one of the confirming conditions alongside stage and other indicators. This threshold reflects Weinstein’s preference for clear market outperformers, not just stocks that happen to be in Stage 2.
When Mansfield RS is borderline or negative:
- A BUY signal may still appear, but with lower confidence
- The signal reason will reference the RS situation
- You should apply extra scrutiny before acting
Mansfield RS in different market regimes
Mansfield RS is a relative metric—it compares the stock to SPY, not to an absolute standard. This creates an important consideration across different market environments:
Bull market: Most stocks show positive RS during a broad advance. Mansfield RS helps you identify the leaders within that advance—the stocks most worth owning.
Bear market: Most stocks show negative RS during a broad decline. But even in a bear market, some stocks (defensive sectors, counter-cyclical names) maintain positive RS. These are the stocks Weinstein would argue are worth considering or holding.
Choppy market: RS becomes more volatile. Short-term swings in the SPY/stock ratio can whipsaw the Mansfield RS value. Longer smoothing windows are more reliable in range-bound markets.
Always read Mansfield RS alongside the broader market conditions before drawing conclusions.
Practical takeaways
- Prefer positive Mansfield RS when evaluating Stage 2 candidates. It confirms that the market is recognizing the stock’s strength.
- Watch RS direction, not just level. RS improving from -10 to +5 is more constructive than RS drifting from +30 to +20.
- Be cautious when RS turns negative in Stage 3. If a stock that previously outperformed the market begins to lag, it’s often an early warning that distribution is accelerating.
- Don’t use RS in isolation. A stock with excellent Mansfield RS but in Stage 4 is still in Stage 4. RS tells you relative performance; stage analysis tells you price structure.
- SPY is the benchmark. Mansfield RS measures outperformance vs the S&P 500 specifically. In markets where SPY itself is weak, positive RS may still accompany modest absolute losses.
Limitations
- SPY as a benchmark is imperfect. For sector-specific stocks (utilities, REITs, small-cap), comparison to SPY may not reflect the most relevant peer universe.
- Data timing. RS depends on the same data freshness as all ATHENA outputs. Check when the last batch analysis was completed before acting on the reading.
- The lookback window matters. Different smoothing periods produce different RS values. TRINITY uses a specific computation window; comparing its RS values to third-party sources using different windows will produce different results.
Mansfield RS is a calculated indicator derived from market data and is subject to revision as new data is processed. It does not constitute investment advice. Past relative performance does not guarantee future outperformance. See Disclosures.
Progress is saved in this browser. Cloud sync requires PUBLIC_IRIS_API_BASE, IRIS CORS allowlist,
and window.__trinityIdToken.